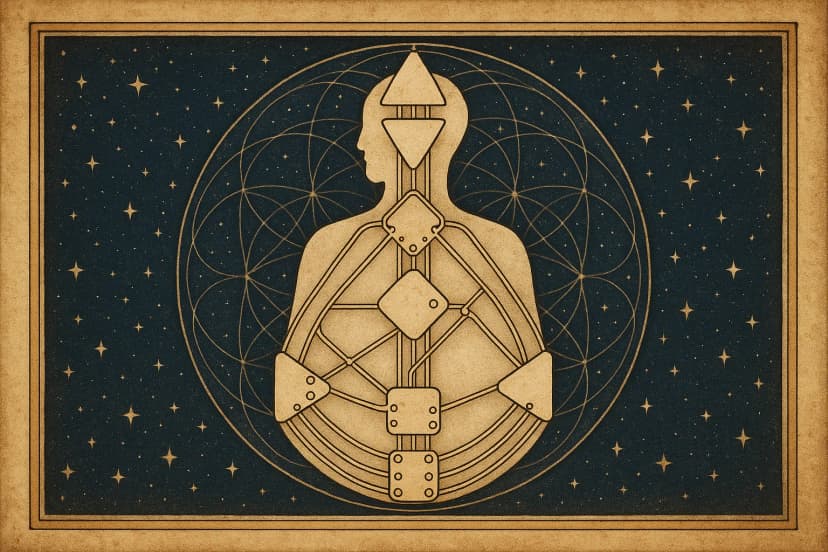
They want to SEE it. The diamond-shaped layout with colored centers, channels lighting up between them, gate numbers positioned around the figure. The visual bodygraph IS Human Design for most users -- it is the chart they share on Instagram, screenshot to friends, and stare at trying to understand themselves.
Building SVG bodygraph rendering from scratch? That is 3-6 months of geometry work. Positioning 9 centers in the correct diamond layout, drawing 36 channels as paths between them, placing 64 gate labels at the right endpoints, handling color states for defined vs undefined, layering personality and design activations, making it responsive, adding transit overlays. It is a project unto itself.
We recently shipped SVG bodygraph generation as an API endpoint. One request, one response, one production-ready SVG. This guide covers how to use it.
TL;DR
- New API endpoint generates complete bodygraph SVGs server-side
- 9 centers, 36 channels, 64 gates -- all correctly positioned and colored
- Two built-in themes: Dark (for dark UIs) and Classic (light background)
- Transit overlay support: layer current planetary transits on any birth chart
- Composite chart SVGs for two-person connection analysis
- Combined legend panels showing Type, Authority, Profile, and active gates
- Response times under 300ms, SVG files typically 15-40KB
- Works with existing Human Design API calculation endpoints
What is New: SVG Bodygraph Rendering
The new SVG endpoint handles the entire rendering pipeline:
Getting Your First Bodygraph SVG
Here is the simplest possible request. You send birth data, you get an SVG back.
1curl -X POST "https://api.astrology-api.io/v1/human-design/bodygraph-svg" \2 -H "Authorization: Bearer YOUR_API_KEY" \3 -H "Content-Type: application/json" \4 -d '{5 "birth_date": "1990-06-15",6 "birth_time": "14:30",7 "birth_location": {"latitude": 40.7128, "longitude": -74.006},8 "theme": "dark"9 }'The response is a JSON object containing the SVG markup and metadata:
1{2 "svg": "<svg xmlns=\"http://www.w3.org/2000/svg\" viewBox=\"0 0 600 800\">...</svg>",3 "metadata": {4 "type": "Generator",5 "authority": "Sacral",6 "profile": "3/5",7 "definition": "Single",8 "defined_centers": ["Sacral", "Root", "Spleen", "G Center"],9 "active_channels": ["34-57", "10-57", "48-16"],10 "active_gates": [34, 57, 10, 48, 16, 64, 47, 6, 36]11 },12 "dimensions": {13 "width": 600,14 "height": 80015 }16}svg field contains a complete, self-contained SVG string. No external dependencies, no font files to load, no CSS to include. You can drop it directly into any HTML page or render it in a React component.Embedding in a Web Page
The most straightforward approach:
1const response = await fetch('https://api.astrology-api.io/v1/human-design/bodygraph-svg', {2  method: 'POST',3  headers: {4    'Authorization': 'Bearer YOUR_API_KEY',5    'Content-Type': 'application/json'6  },7  body: JSON.stringify({8    birth_date: '1990-06-15',9    birth_time: '14:30',10    birth_location: { latitude: 40.7128, longitude: -74.006 },11    theme: 'classic'12  })13});14
15const data = await response.json();16
17// Inject SVG directly into the DOM18document.getElementById('bodygraph-container').innerHTML = data.svg;viewBox attribute. Set the container width and the chart fills it proportionally. On mobile, a 320px-wide container renders a perfectly readable bodygraph. On desktop, it scales up to whatever size you need.Theme Customization: Dark vs Classic
The two built-in themes serve different UI contexts.
You can also pass additional styling parameters:
1curl -X POST "https://api.astrology-api.io/v1/human-design/bodygraph-svg" \2 -H "Authorization: Bearer YOUR_API_KEY" \3 -H "Content-Type: application/json" \4 -d '{5 "birth_date": "1990-06-15",6 "birth_time": "14:30",7 "birth_location": {"latitude": 40.7128, "longitude": -74.006},8 "theme": "dark",9 "options": {10 "show_legend": true,11 "show_gate_numbers": true,12 "show_channel_names": false,13 "highlight_personality": true,14 "width": 800,15 "height": 100016 }17 }'show_legend option adds a panel below the bodygraph with the person's Type, Authority, Profile, and a list of defined centers and channels. The show_gate_numbers toggle controls whether gate numbers appear at channel endpoints. For simpler, cleaner visuals (like social media sharing), you might turn gate numbers off.Transit Visualization: What Is Active Right Now
This is the feature that makes HD apps sticky. Users do not just want their birth chart -- they want to know what transits are active today and how those transits interact with their design.
The transit overlay endpoint takes a natal chart and a transit datetime, then renders both layers in a single SVG:
1curl -X POST "https://api.astrology-api.io/v1/human-design/bodygraph-svg" \2 -H "Authorization: Bearer YOUR_API_KEY" \3 -H "Content-Type: application/json" \4 -d '{5 "birth_date": "1990-06-15",6 "birth_time": "14:30",7 "birth_location": {"latitude": 40.7128, "longitude": -74.006},8 "transit_datetime": "2026-03-02T12:00:00Z",9 "theme": "dark",10 "options": {11 "show_legend": true,12 "transit_color": "#4FC3F7",13 "show_transit_gates": true14 }15 }'In the resulting SVG, natal activations render in their standard colors while transit activations appear in the specified transit color (light blue by default). When a transit gate completes a channel that was previously "hanging" in the natal chart, that newly completed channel gets a special highlight -- this is the moment of activation that HD practitioners care about most.
- Daily transit updates: Generate a fresh bodygraph each morning showing today's transits layered on the user's birth chart. Push notifications when significant channels activate.
- Transit calendars: Pre-generate transit bodygraphs for the coming week or month. Show users which days will activate specific channels.
- Real-time transit displays: Update the bodygraph every few hours as the Moon moves through gates (the Moon moves through roughly one gate every 5-6 hours).
The transit data in the response metadata tells you exactly which gates are activated by transits and which new channels they complete:
1{2 "transit_gates": [41, 19, 13, 25, 36, 22],3 "transit_completed_channels": ["19-49"],4 "transit_datetime": "2026-03-02T12:00:00Z"5}Composite and Connection Charts
For apps that offer compatibility or relationship analysis (and you should -- it is one of the most requested features), the API generates composite bodygraph SVGs showing two charts overlaid:
1curl -X POST "https://api.astrology-api.io/v1/human-design/composite-bodygraph-svg" \2 -H "Authorization: Bearer YOUR_API_KEY" \3 -H "Content-Type: application/json" \4 -d '{5 "person_a": {6 "birth_date": "1990-06-15",7 "birth_time": "14:30",8 "birth_location": {"latitude": 40.7128, "longitude": -74.006}9 },10 "person_b": {11 "birth_date": "1988-11-22",12 "birth_time": "09:15",13 "birth_location": {"latitude": 51.5074, "longitude": -0.1278}14 },15 "theme": "dark",16 "options": {17 "show_legend": true,18 "person_a_color": "#E040FB",19 "person_b_color": "#40C4FF",20 "electromagnetic_color": "#FFD740"21 }22 }'The composite SVG uses color coding to show which activations belong to which person:
- Person A's activations render in one color (pink by default)
- Person B's activations render in another color (blue by default)
- Electromagnetic connections (where Person A has one gate and Person B has the other, completing a channel) render in a highlight color (gold by default)
- Compromise gates (where both people have the same hanging gate) get a distinct marker
The legend panel for composite charts includes both people's Types, the number of electromagnetic connections, composite channels, and compromise gates. This gives users an immediate visual understanding of where their energies meet, complete, or compete.
Integration Patterns for Real Apps
React / Next.js Component
Here is a production-ready React component for rendering bodygraph SVGs:
1'use client';2
3import { useState, useEffect } from 'react';4
5interface BodygraphProps {6  birthDate: string;7  birthTime: string;8  latitude: number;9  longitude: number;10  theme?: 'dark' | 'classic';11  showLegend?: boolean;12  transitDatetime?: string;13  className?: string;14}15
16interface BodygraphResponse {17  svg: string;18  metadata: {19    type: string;20    authority: string;21    profile: string;22    definition: string;23    defined_centers: string[];24    active_channels: string[];25  };26}27
28export function Bodygraph({29  birthDate,30  birthTime,31  latitude,32  longitude,33  theme = 'dark',34  showLegend = true,35  transitDatetime,36  className37}: BodygraphProps) {38  const [data, setData] = useState<BodygraphResponse | null>(null);39  const [loading, setLoading] = useState(true);40  const [error, setError] = useState<string | null>(null);41
42  useEffect(() => {43    const fetchBodygraph = async () => {44      setLoading(true);45      setError(null);46
47      try {48        const body: Record<string, unknown> = {49          birth_date: birthDate,50          birth_time: birthTime,51          birth_location: { latitude, longitude },52          theme,53          options: { show_legend: showLegend, show_gate_numbers: true }54        };55
56        if (transitDatetime) {57          body.transit_datetime = transitDatetime;58        }59
60        const response = await fetch(61          'https://api.astrology-api.io/v1/human-design/bodygraph-svg',62          {63            method: 'POST',64            headers: {65              'Authorization': `Bearer ${process.env.NEXT_PUBLIC_ASTROLOGY_API_KEY}`,66              'Content-Type': 'application/json'67            },68            body: JSON.stringify(body)69          }70        );71
72        if (!response.ok) {73          throw new Error(`API error: ${response.status}`);74        }75
76        const result = await response.json();77        setData(result);78      } catch (err) {79        setError(err instanceof Error ? err.message : 'Failed to load bodygraph');80      } finally {81        setLoading(false);82      }83    };84
85    fetchBodygraph();86  }, [birthDate, birthTime, latitude, longitude, theme, showLegend, transitDatetime]);87
88  if (loading) {89    return (90      <div className={className} style={{ display: 'flex', justifyContent: 'center', padding: '2rem' }}>91        <span>Generating bodygraph...</span>92      </div>93    );94  }95
96  if (error) {97    return (98      <div className={className} style={{ color: '#ef4444', padding: '1rem' }}>99        Error: {error}100      </div>101    );102  }103
104  if (!data) return null;105
106  return (107    <div className={className}>108      <div109        dangerouslySetInnerHTML={{ __html: data.svg }}110        style={{ width: '100%', maxWidth: '600px', margin: '0 auto' }}111      />112      <div style={{ marginTop: '1rem', fontSize: '0.875rem', opacity: 0.7 }}>113        {data.metadata.type} | {data.metadata.authority} Authority | {data.metadata.profile} Profile114      </div>115    </div>116  );117}
Usage in a page:
1<Bodygraph2 birthDate="1990-06-15"3 birthTime="14:30"4 latitude={40.7128}5 longitude={-74.006}6 theme="dark"7 showLegend={true}8/>Mobile App Integration (React Native / Flutter)
Since the API returns SVG as a string, mobile integration follows the same pattern:
react-native-svg or render the SVG inside a WebView. The WebView approach is simpler and handles all SVG features without compatibility issues. Wrap the SVG in a minimal HTML document with viewport meta tags for proper scaling.flutter_svg package to render the SVG string directly. Parse the response JSON, extract the svg field, and pass it to SvgPicture.string().WKWebView or a library like SVGKit. On Android, use AndroidSVG or WebView.PDF Report Integration
For generating PDF reports with embedded bodygraphs, the SVG output works directly with most PDF generation libraries:
- Node.js: Use
puppeteerto render an HTML page with the SVG, then export to PDF - Python: Use
cairosvgto convert the SVG to PNG, then embed in PDF withreportlab - Server-side: Use
sharp(Node.js) to convert SVG to PNG at any resolution for embedding
The SVG is vector-based, so it renders crisp at any resolution -- perfect for print-quality PDF reports.
Caching Strategy
Bodygraph SVGs are deterministic: the same birth data always produces the same chart. Cache aggressively.
1// Simple in-memory cache with birth data as key2const cache = new Map();3
4function getCacheKey(birthDate, birthTime, lat, lng, theme) {5  return `${birthDate}|${birthTime}|${lat}|${lng}|${theme}`;6}7
8async function getBodygraph(params) {9  const key = getCacheKey(10    params.birth_date,11    params.birth_time,12    params.birth_location.latitude,13    params.birth_location.longitude,14    params.theme15  );16
17  if (cache.has(key)) {18    return cache.get(key);19  }20
21  const result = await fetchFromApi(params);22  cache.set(key, result);23  return result;24}
For transit charts, cache with a shorter TTL since transit positions change throughout the day. A 1-hour TTL works well for most use cases -- the Moon moves slowly enough that hourly updates capture meaningful changes without excessive API calls.
Performance and Pricing
- Free: $0/month -- 50 requests. Enough to prototype and test your integration.
- Starter: $11/month -- 1,000 requests. Suitable for small apps or personal projects.
- Professional: $37/month -- 55,000 requests. Handles moderate production traffic.
- Business: $99/month -- 220,000 requests. Full access to all endpoints including composite charts.
- Enterprise: $399+/month -- Unlimited requests with dedicated infrastructure.
The free tier gives you 50 bodygraph SVGs per month -- enough to build and demo your entire integration before committing to a paid plan.
Why Use the API Instead of Building Your Own
We have talked to dozens of developers who started building bodygraph rendering from scratch. Here is what they ran into.
| Task | DIY Estimate | API Approach |
|---|---|---|
| Center layout and shapes | 1-2 weeks | 0 (included) |
| Channel path rendering | 1-2 weeks | 0 (included) |
| Gate label positioning | 1 week | 0 (included) |
| Color state management | 1 week | 0 (included) |
| Transit overlay rendering | 1-2 weeks | 0 (included) |
| Composite chart rendering | 1-2 weeks | 0 (included) |
| Theme support | 1 week | 0 (included) |
| Responsive scaling | 3-5 days | 0 (SVG viewBox) |
| Testing and edge cases | 2-4 weeks | 1-2 days |
| Total | 3-6 months | 1-2 days |
And the DIY approach requires ongoing maintenance. Every time the community adopts a new visual convention or you want to add a feature like transit overlays, you are back in the rendering code.
Putting It All Together
Here is a realistic integration timeline for adding bodygraph visualization to an existing app:
That is it. Two weeks from "we should add bodygraph visuals" to production-ready charts in your app. Compare that to the months of geometry work required to build rendering from scratch.
Getting Started
If you are building a Human Design app and need bodygraph visualization, here is the path:
-
Sign up for a free API key at astrology-api.io -- 50 free requests per month, no credit card required.
-
Make your first SVG request using the curl example above. Verify the output looks right.
-
Build your component using the React example or adapt it to your framework.
-
Add transit and composite features as your app grows.
-
Review the full API documentation at API Documentation for all available parameters, response fields, and edge case handling.
The hard rendering work is done. Your job is to build the experience around it.